|
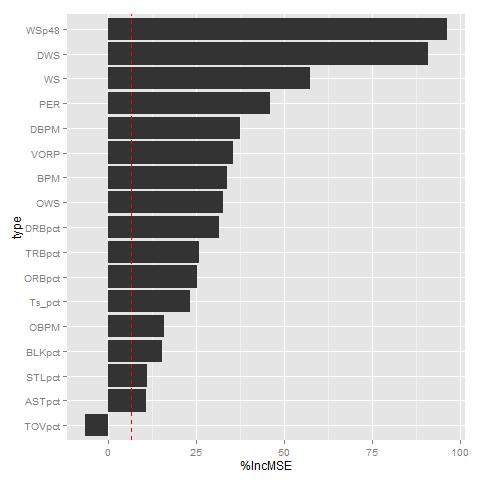
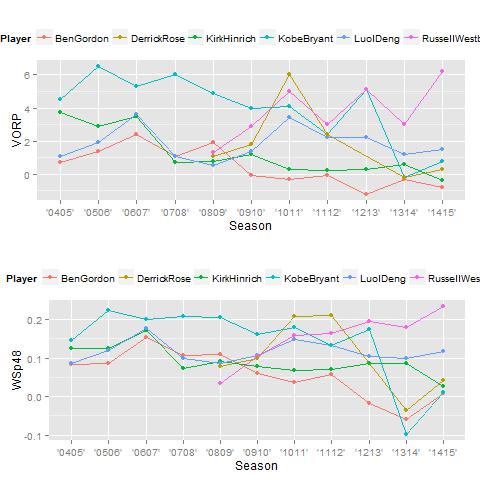
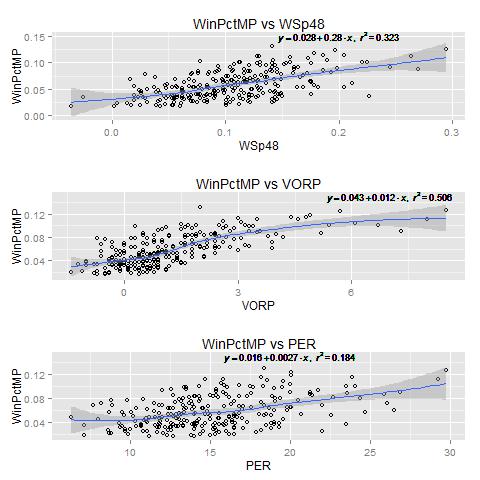
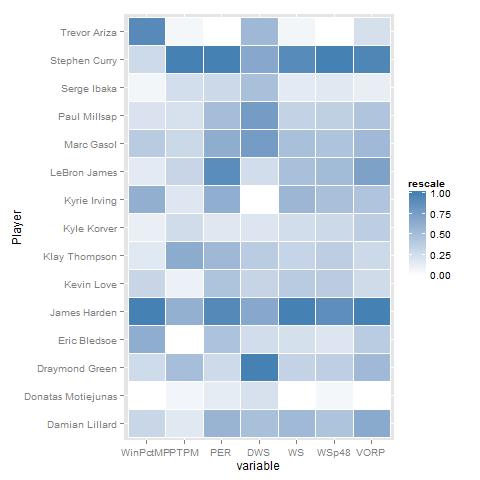
.In NBA_WinsPredict1415.r, I obtained data from http://www.basketball-reference.com/leagues/NBA_2015_advanced.html I also modified the file so that WinPct is the winning percentage of the player's team as of 3/19/15 I wanted to predict which player statistics best predicts the team's winning percentage I set WinPct as the dependent variable. I used the following as predictors: PER, Ts_pct, ORBpct, DRBpct, TRBpct, ASTpct, STLpct, BLKpct, TOVpct, OWS , DWS, WS, WSp48, OBPM, DBPM , BPM , and VORP (see basketball-reference.com for meaning of these variables). I performed a Random Forest on nearly every predictor statistic variable. The results of the relative importance for each predictor are displayed in ggplot_RF.jpg (at the bottom of this post). Based on this, WSp48(player's win shares per 48 minutes) best predicts a team's win, followed by DWS (defensive win shares). It seems strange that WSp48 and DWS are greater predictors of a team's victories than OWS and WS since WS is just OWS+DWS (see NBA_WinsPredict1415.r for details) I then performed a multiple linear regression on that same dataset. PER,ORBpct,DRBpct,TRBpct,ASTpct,TOVpct,WSp48,OBPM,DBPM,BPM all have p-values less than 0.05 However, OWS,DWS, and WS all have p-values greater than .74 Using the relimp, the variables with highest relative importance were WSp48, ORBpct, DRBpct, and TRBpct I also wanted to see if the regression and random forest would be any different if I focused only on guards (PG) and (SG). The statistical analysis for only Guards is in "NBA_WinsPredict1314_weighted_PG_SG.r" In PTPM.r, I downloaded data from https://docs.google.com/spreadsheets/d/1GtCDQw94kpcOw_kPhyH8F5cIjPT3QTsOGqvrX_hMCo8/edit?pli=1#gid=0 I used a multiple linear regression to determine which variables had the greatest impact on the team's winning percentage TeamDefEffect had the highest relative importance value, but it's p-value is .585 I also wanted to see which of PTPM, WSp48 and VORP best predicts the team win percentage for a given player. The R-script is in "NBA_WinsPredict1415_WS_VORP_vsPTPM.r" I also created a heat map for PTPM, PER, DWS, WS, WSp48, and VORP. but only the players with the top 15 values of WinPctMP. See "Heatmap1415_WS_VORP_PTPM.r" (on my github page. See details at bottom of this post) and the heat map " WSvsVORPvsPTPM_top15_Heatmap.jpg" at the bottom of this post I also created line charts of the VORP vs Season and WSp48 vs Season for several NBA players. See LineChartOfPlayersVORP_WSp.r and LineChart_VORP_WSpvsSeason.jpg (plot is at the bottom of this post). I also created Loess regression plots as seen in NBA_WinsPredict1314_Loess.r and Loess_WinPctMPvsWS_VORP_PER1.jpg (See bottom) The equivalent work I have done using Python can be seen at https://github.com/jk34/Python/
0 Comments
Leave a Reply. |
AuthorHello world, my name is Jerry Kim. I have a Master's Degree in Physics and years of work experience in Image Processing, Machine Learning, and Deep Learning. I mostly have used C++, Matlab, and Python. I created this website to showcase a small sample of the things that I have worked on Archives
March 2017
Categories |
 RSS Feed
