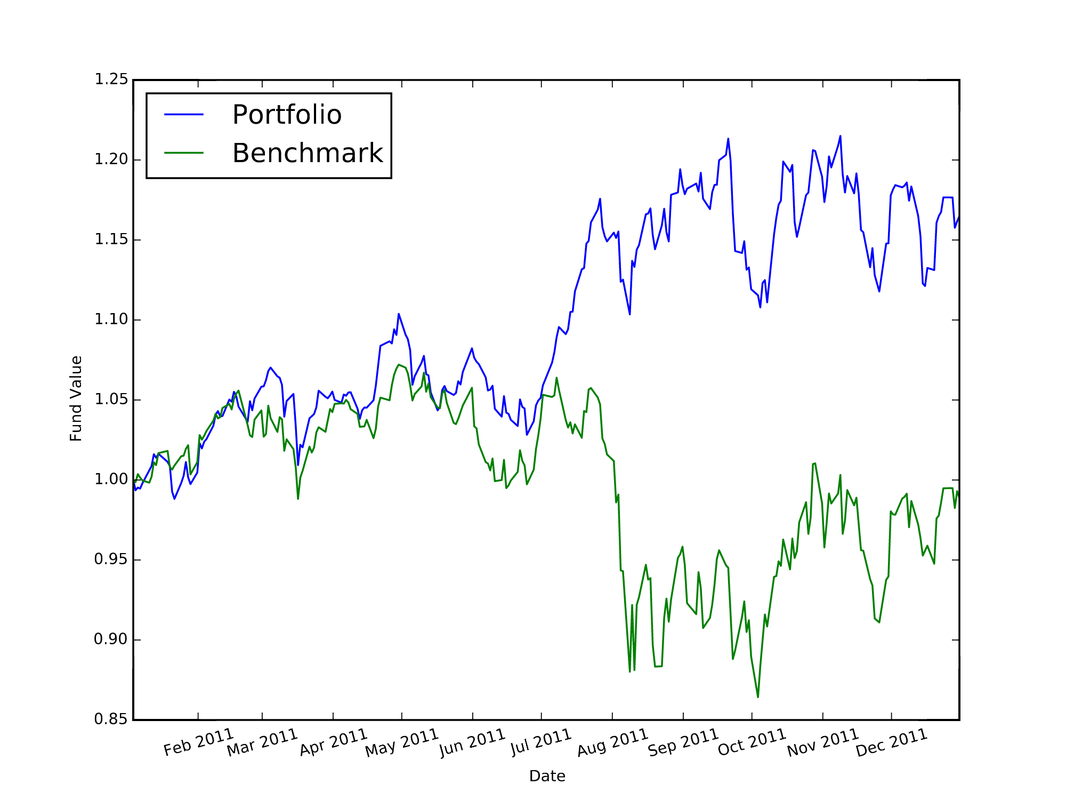
 I used Python to complete the assignments for the coursera course "Computational Investing". The description of the course and the assignments is located at: http://wiki.quantsoftware.org/index.php?title=Computational_Investing_I For the assignments, I used the QSTK package, which supports portfolio construction and management. It is described further at: http://wiki.quantsoftware.org/index.php?title=QuantSoftware_ToolKit For the 1st assignment, I wrote the program hw1.py. which simulates how the stocks in a given portfolio perform over time and computes the statistics of the final values of the stocks to see how much profit/loss you got with this portfolio. The program also contains a portfolio optimizer to test every "legal" set of allocations to the 4 given stocks to see which allocation of stocks produces the best portfolio. The plot below (and which is also located in my Github repository at https://github.com/jk34/Computational_Investing_Python_Coursera) shows the value of the portfolio compared to a benchmark (S&P 500 index) over time For the 2nd assignment, the program hw2.py (code details at my github page) conducts "event studies" to see how stock price "events" affect future prices. An event is defined as when the actual close of a stock price drops below $5.00 when its actual close was at least $5 the previous day. It uses the Event Profiler provided in QSTK. The event profiler output, which allows us to see how stocks perform after a market event, is displayed in the plot below 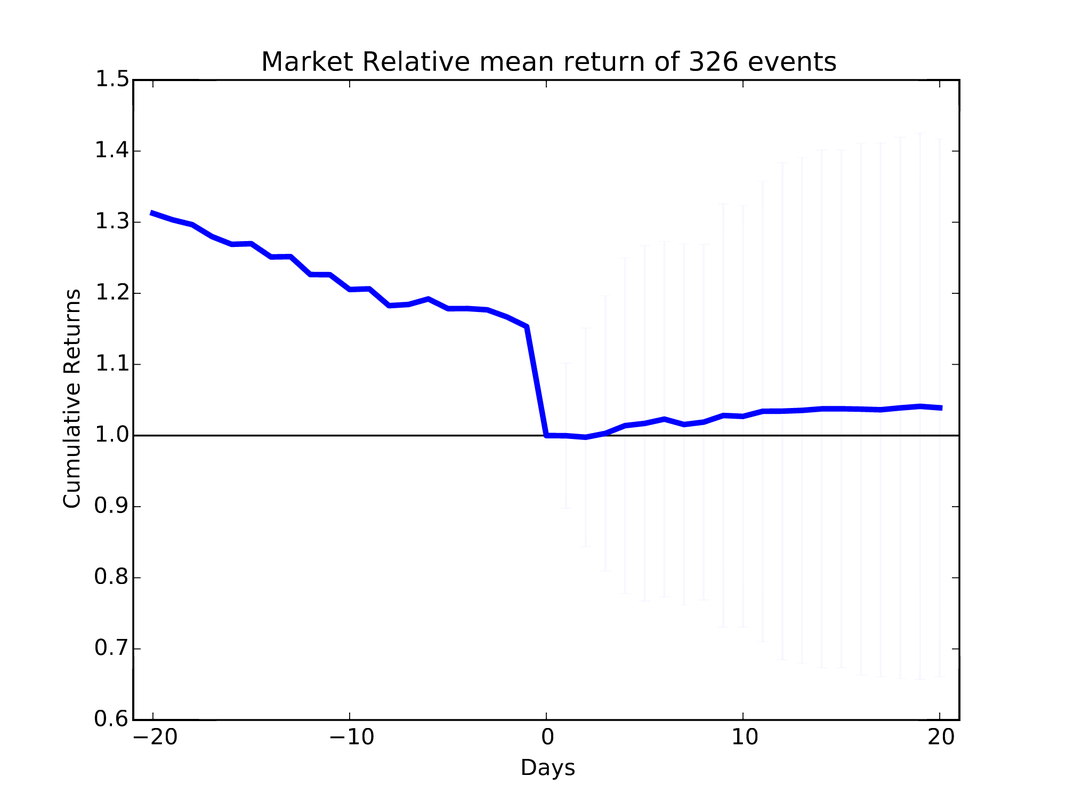 For the 3rd assignment, I first wrote "hw3_marketsim.py", which creates a market simulator that accepts trading orders (buy and/or sell stocks) and keeps track of the value of the portfolio containing all the equities by using the values of the stocks in historical data. The market simulator is used if you have a trading strategy containing trades you want to execute. The simulator then simulates those trades by executing them "hw3_analyze.py" then analyzes the performance of that portfolio by computing the Sharpe Ratio, Standard Deviation, Average Daily Return of Fund, and Total/Cumulative Return of your strategy in order to measure the performance of that strategy. The "marketsim-guidelines.pdf" file explains how to build the simulator, and is located at http://wiki.quantsoftware.org/index.php?title=CompInvesti_Homework_3 The plot below shows the value of the portfolio compared to a benchmark (S&P 500 index) over time 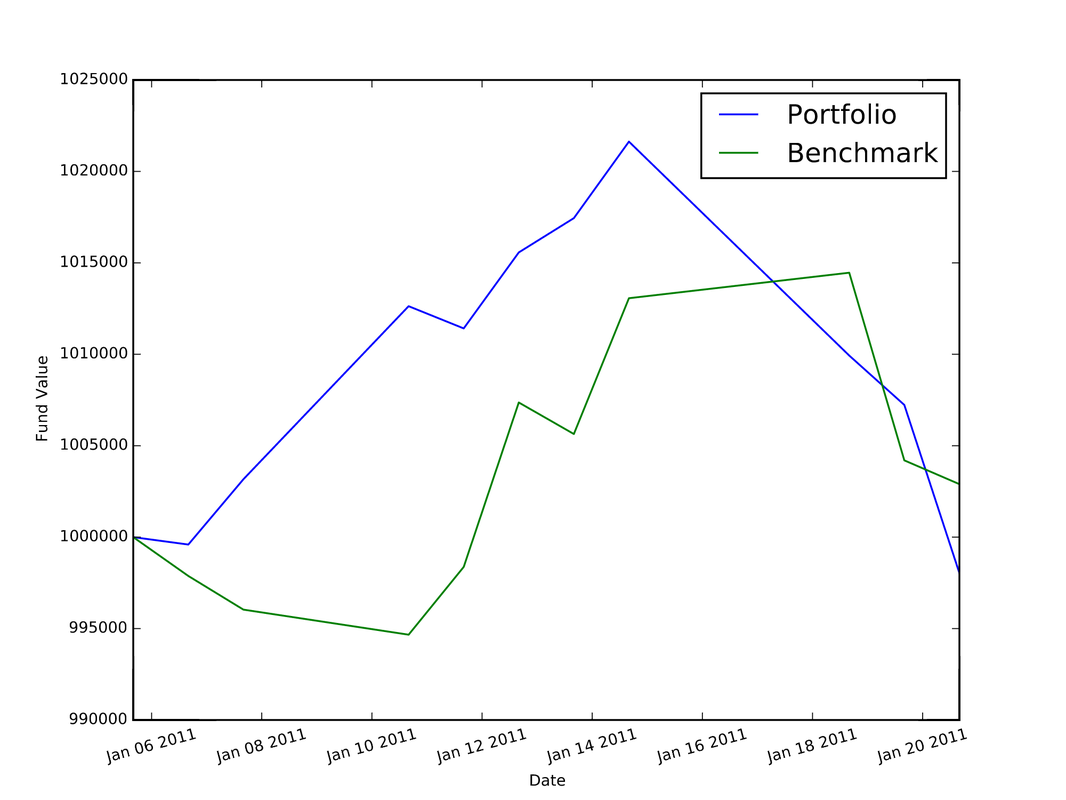 For the 4th assignment, my program "hw4.py" combines the Event Study in "hw2.py" with the market simulator in "hw3_marketsim.py" by taking the output of the Event Study in hw2.py as a trading strategy and then inputting it into the market simulator I created in "hw3.py". This program creates a trading strategy by specifying that when an event occurs, we will buy 100 shares of the equity on that day and then sell it 5 trading days later. The plot below shows the value of the portfolio compared to a benchmark (S&P 500 index) over time 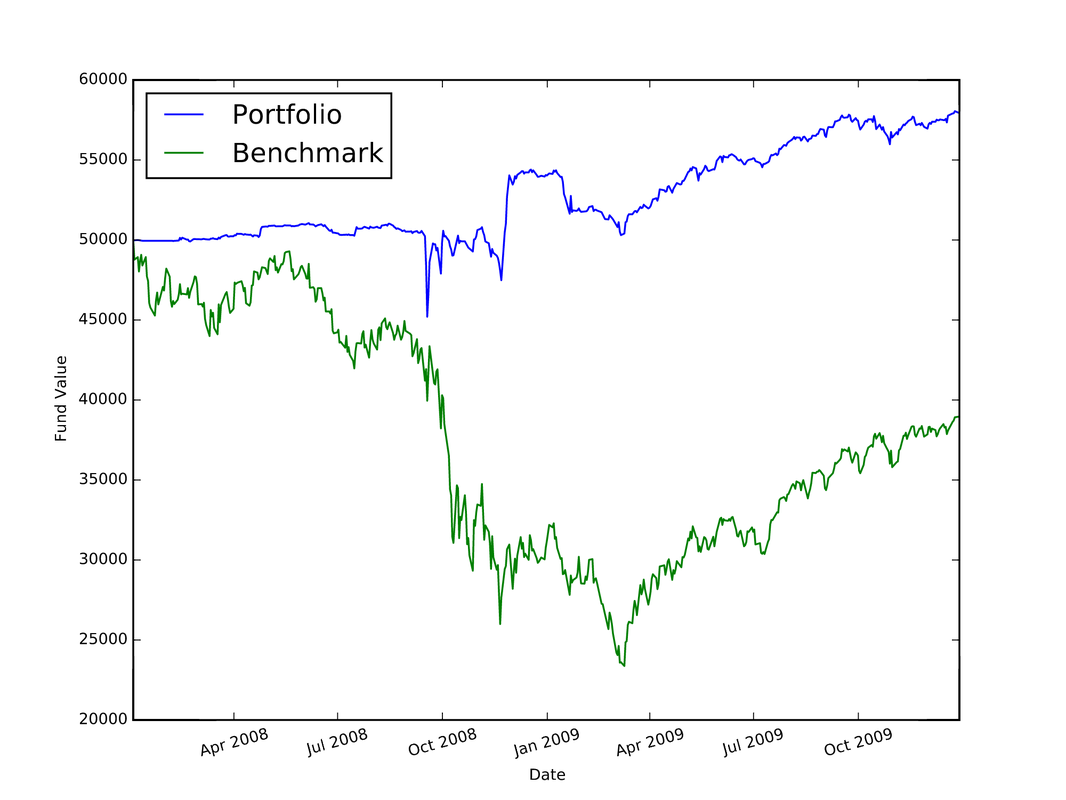 For the 5th assignment, "hw5.py" first computes the rolling mean, the stock price, and upper and lower bands. Then, it computes the Bollinger bands. The results are plotted below 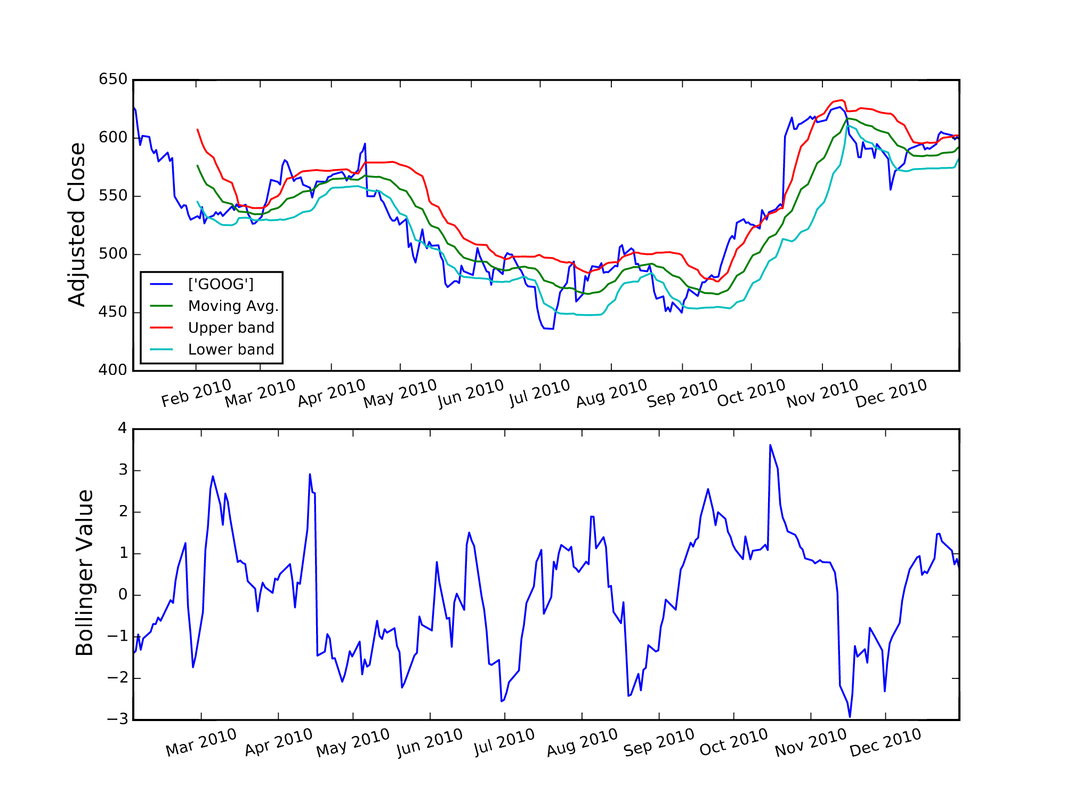
0 Comments
Leave a Reply. |
AuthorHello world, my name is Jerry Kim. I have a Master's Degree in Physics and years of work experience in Image Processing, Machine Learning, and Deep Learning. I mostly have used C++, Matlab, and Python. I created this website to showcase a small sample of the things that I have worked on Archives
March 2017
Categories |
 RSS Feed
